EV Battery Life Calculator (Degradation by Year)
Enter the age of an electric car's battery to see how much capacity and range it keeps, or enter its health to find the yearly loss.
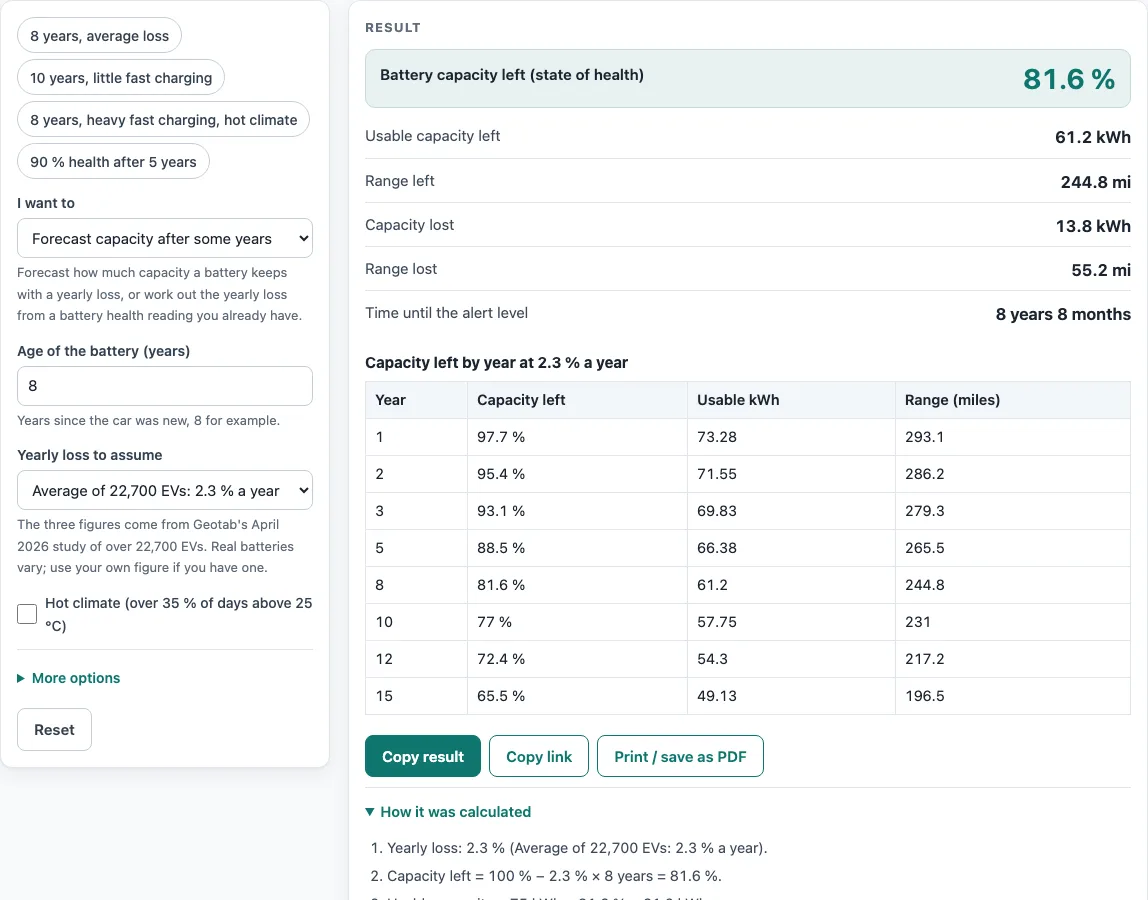
How to use the EV battery degradation calculator
- Open the I want to drop-down and choose either Forecast capacity after some years or Find the yearly loss from a health reading.
- Enter the Age of the battery (years), which is the number of years since the car was new.
- In health reading mode, enter Battery health today (%) from your car or a battery test.
- In forecast mode, pick a Yearly loss to assume from the drop-down. To use your own rate, choose My own figure and type it into Capacity lost per year (%).
- Tick Hot climate (over 35 % of days above 25 °C) if it applies to you.
- Open More options to add Battery capacity when new (kWh), Range when new (miles) and an Alert level (%). The alert level shows how many years until the battery reaches that capacity.
- Read the result rows, then check the table of capacity left by year and the How it was calculated steps.
The example buttons above the form fill in sample inputs, which is a quick way to see how the fields interact. Copy result copies the result lines with a link, and Copy link stores every input in the page address so the same calculation reopens later. Print / save as PDF includes your inputs, results, steps and the date. Reset restores the starting example.
How long does an electric car battery last, and how long do batteries last in a Tesla?
How long a battery lasts depends on the capacity level you need, because capacity falls year by year. In this calculator losses are measured as percentage points of the original capacity, not of what is left, so each year removes the same share of the new battery. The calculator therefore reports a battery’s life as the date it reaches your alert level, not as a fixed number of years.
Choosing that level matters. A warranty minimum, a point where you would sell the car, or a capacity below which the range no longer suits you can each be a sensible alert level. The worked example at 2.3 % a year reaches 80 % after about 8 years and 8 months, and about 70 % after 13 years. A lower alert level gives a longer answer, so set it to the point that matters for your decision.
Is EV battery degradation linear?
The calculator assumes it is. The forecast uses a straight line: capacity % = 100 − yearly loss × years. This is the same straight-line projection Geotab uses for its eight-year figure.
Real batteries do not lose capacity in a perfectly straight line, so forecasts far into the future are rough. The tool shows a warning when a forecast runs many years out, and treats the result as an extrapolation.
The health reading mode works in the opposite direction. It divides the capacity lost by the age to give a yearly rate: yearly loss = (100 − health) ÷ age. For example, 90 % health after 5 years gives (100 − 90) ÷ 5 = 2 % a year. That is slower than Geotab’s 2.3 % average, so the calculator reports it as such. If the calculated loss is far above the 1.5 to 3.0 % range in the Geotab data, the tool asks you to check the value.
Worked examples
| Input | Result |
|---|---|
| 8 years at 2.3 % a year | 81.6 % capacity left (2.3 % a year) |
| 10 years at 1.5 % a year | 85 % capacity left (1.5 % a year) |
| 8 years at 3.4 % a year | 72.8 % capacity left (3.4 % a year) |
| 90 % health after 5 years | 90 % capacity left (2 % a year) |
Calculated by the tool above with these values.
Frequently asked questions
How much does an EV battery degrade per year?
Geotab’s study of over 22,700 electric vehicles found an average loss of 2.3 % of original capacity a year. Vehicles that used DC fast charging in under 12 % of sessions lost 1.5 % a year, and the heaviest fast-charging group lost 3.0 % a year. Your own rate may differ, so you can enter a figure of your own.
Does fast charging increase battery degradation?
According to Geotab’s data, yes. Vehicles with more than 12 % DC fast charging, and more than 40 % of those fast sessions above 100 kW, lost 3.0 % a year, compared with 1.5 % a year for vehicles with little fast charging. To model this, choose the matching option in the Yearly loss to assume drop-down.
Does hot weather degrade an EV battery faster?
Geotab found that vehicles in hot climates, meaning over 35 % of days above 25 °C, lost 0.4 percentage points a year more than those in mild climates. Tick the hot climate box to add that extra loss to your yearly rate.
What is battery state of health (SOH)?
State of health is the share of the original usable battery capacity that is still left. A new battery is 100 %, and 80 % means it holds four-fifths of its original energy. You can find your own reading in the car or from a battery test, then enter it in health reading mode.
Does mileage matter for EV battery degradation?
Geotab’s article gives no mileage figures, so this calculator works from the battery’s age and a yearly loss rather than from miles driven. Any effect of distance is reflected only through the yearly rate you choose.
Does this calculator know my car model?
No. The tool does not know the car model, so a Tesla Model Y or any other EV uses the same Geotab-based rates. If you have a measured figure for your own battery, choose My own figure and enter it.
Related tools
- EV range calculator: use it to estimate how far your car can travel on the energy it has.
- EV efficiency calculator: use it to compare how much energy your car uses per mile or kilometre.
- EV charging time calculator: use it to estimate how long a charge will take at a given power level.
- EV total cost calculator: use it to compare the running and ownership costs of an electric car over time.
- EV vs gas calculator: use it to set an electric car’s running costs against a petrol or diesel car.
- All EV calculators: use it to browse every calculator on the site.
Sources
- Geotab, EV battery health (article dated 28 April 2026): average loss 2.3 % a year over more than 22,700 EVs of 21 models, 1.5 % with little DC fast charging, 3.0 % with heavy fast charging, 0.4 points a year more in hot climates